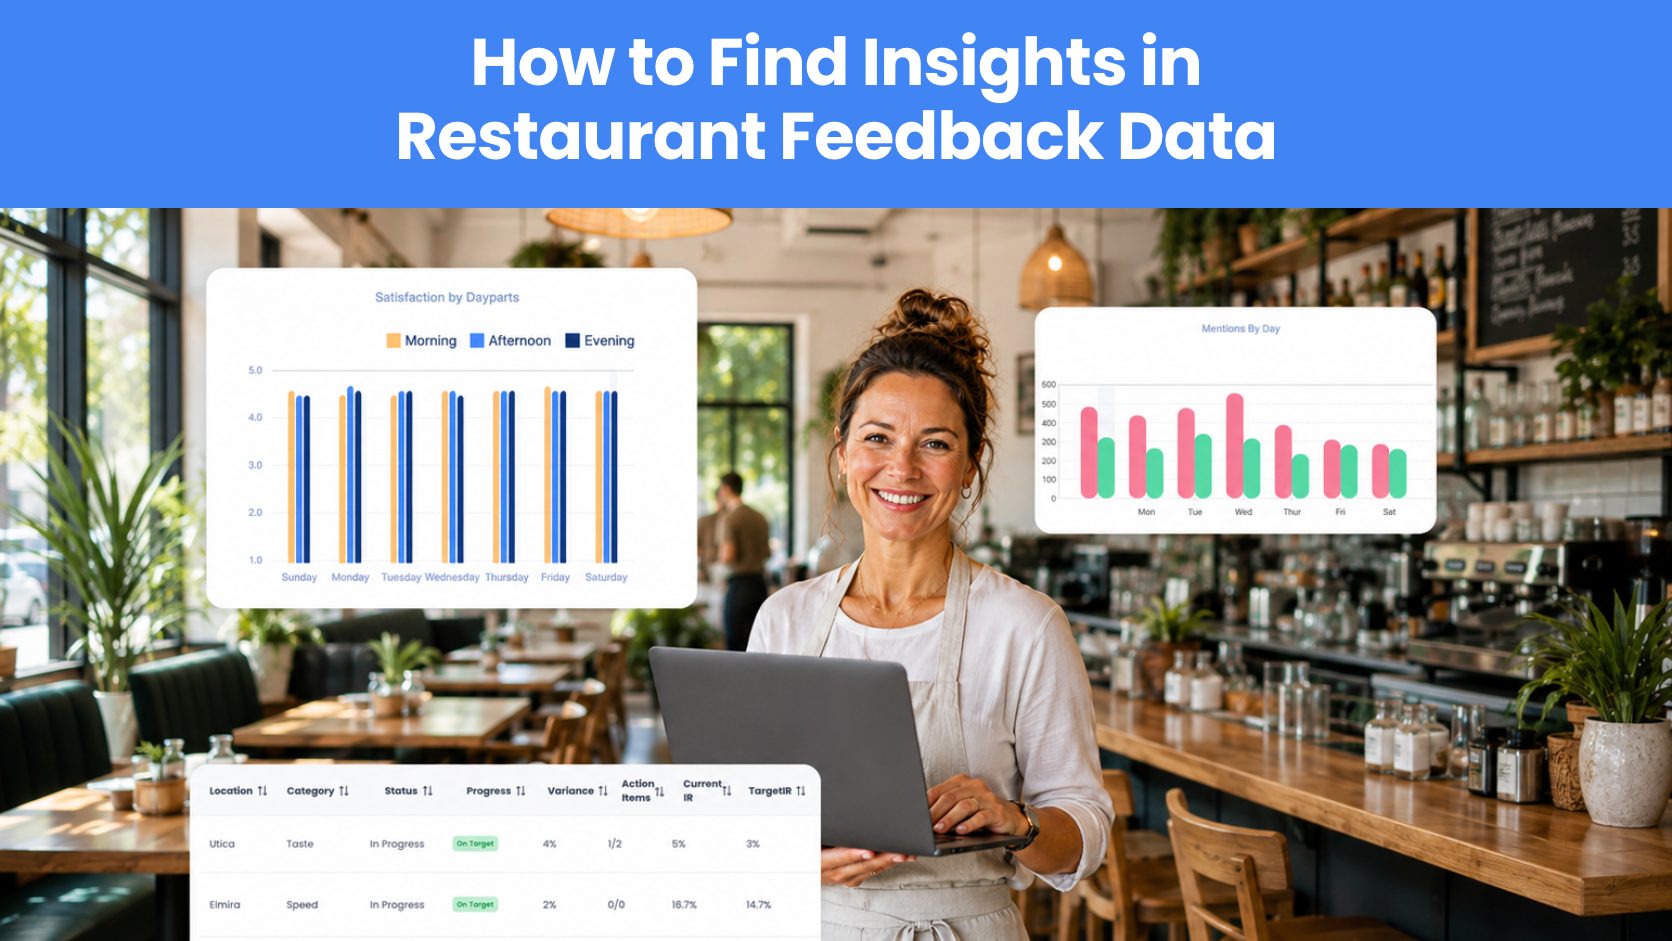
The more feedback channels a restaurant brand adds (reviews, post-visit surveys, comment cards, social mentions, support tickets), the more valuable the data gets, but only if there’s a process to make sense of it. More volume without a system for reading it just means a bigger pile of unread comments.
Turning feedback into insight means going from “here’s what guests said” to “here’s what to fix, in which location, this week.” That shift takes a specific process on top of collection, not a replacement for it.
Feedback Alone Isn’t an Insight
A five-star review and a one-star review sitting side by side in an inbox are just text. Insight only shows up once that text is organized into patterns: which issues come up most, where they’re concentrated, and whether they’re getting better or worse over time.
The gap between feedback and insight is usually a categorization problem. A single comment like “the food was cold and it took forever to get our table” contains two separate issues (food temperature and wait time), and most restaurants have no systematic way to split that apart across thousands of comments a month. Without categorization, teams end up skimming a handful of reviews and guessing at trends instead of measuring them.
Sentiment Analysis Turns Open-Text Comments Into Countable Data
The fastest way to close that gap is AI-driven sentiment analysis. Instead of reading every comment manually, an algorithm reads the open-text feedback, marks it positive or negative, and tags it against a defined set of restaurant-specific categories, things like speed of service, order accuracy, food temperature, and staff friendliness.
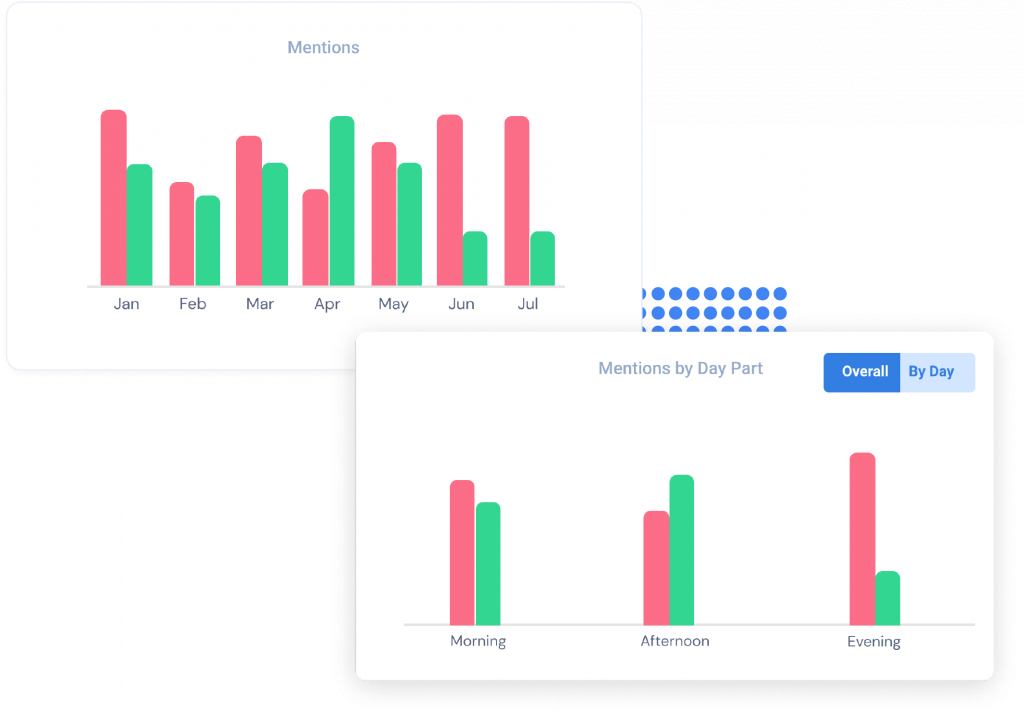
Once feedback is tagged this way, it becomes something you can count, chart, and track over time. “Guests keep complaining about missing items” turns into “order accuracy mentions are up 12% this month at three locations,” which is a much easier problem to assign and solve.
Menu-Level Feedback Reveals What to Fix, Promote, or Cut
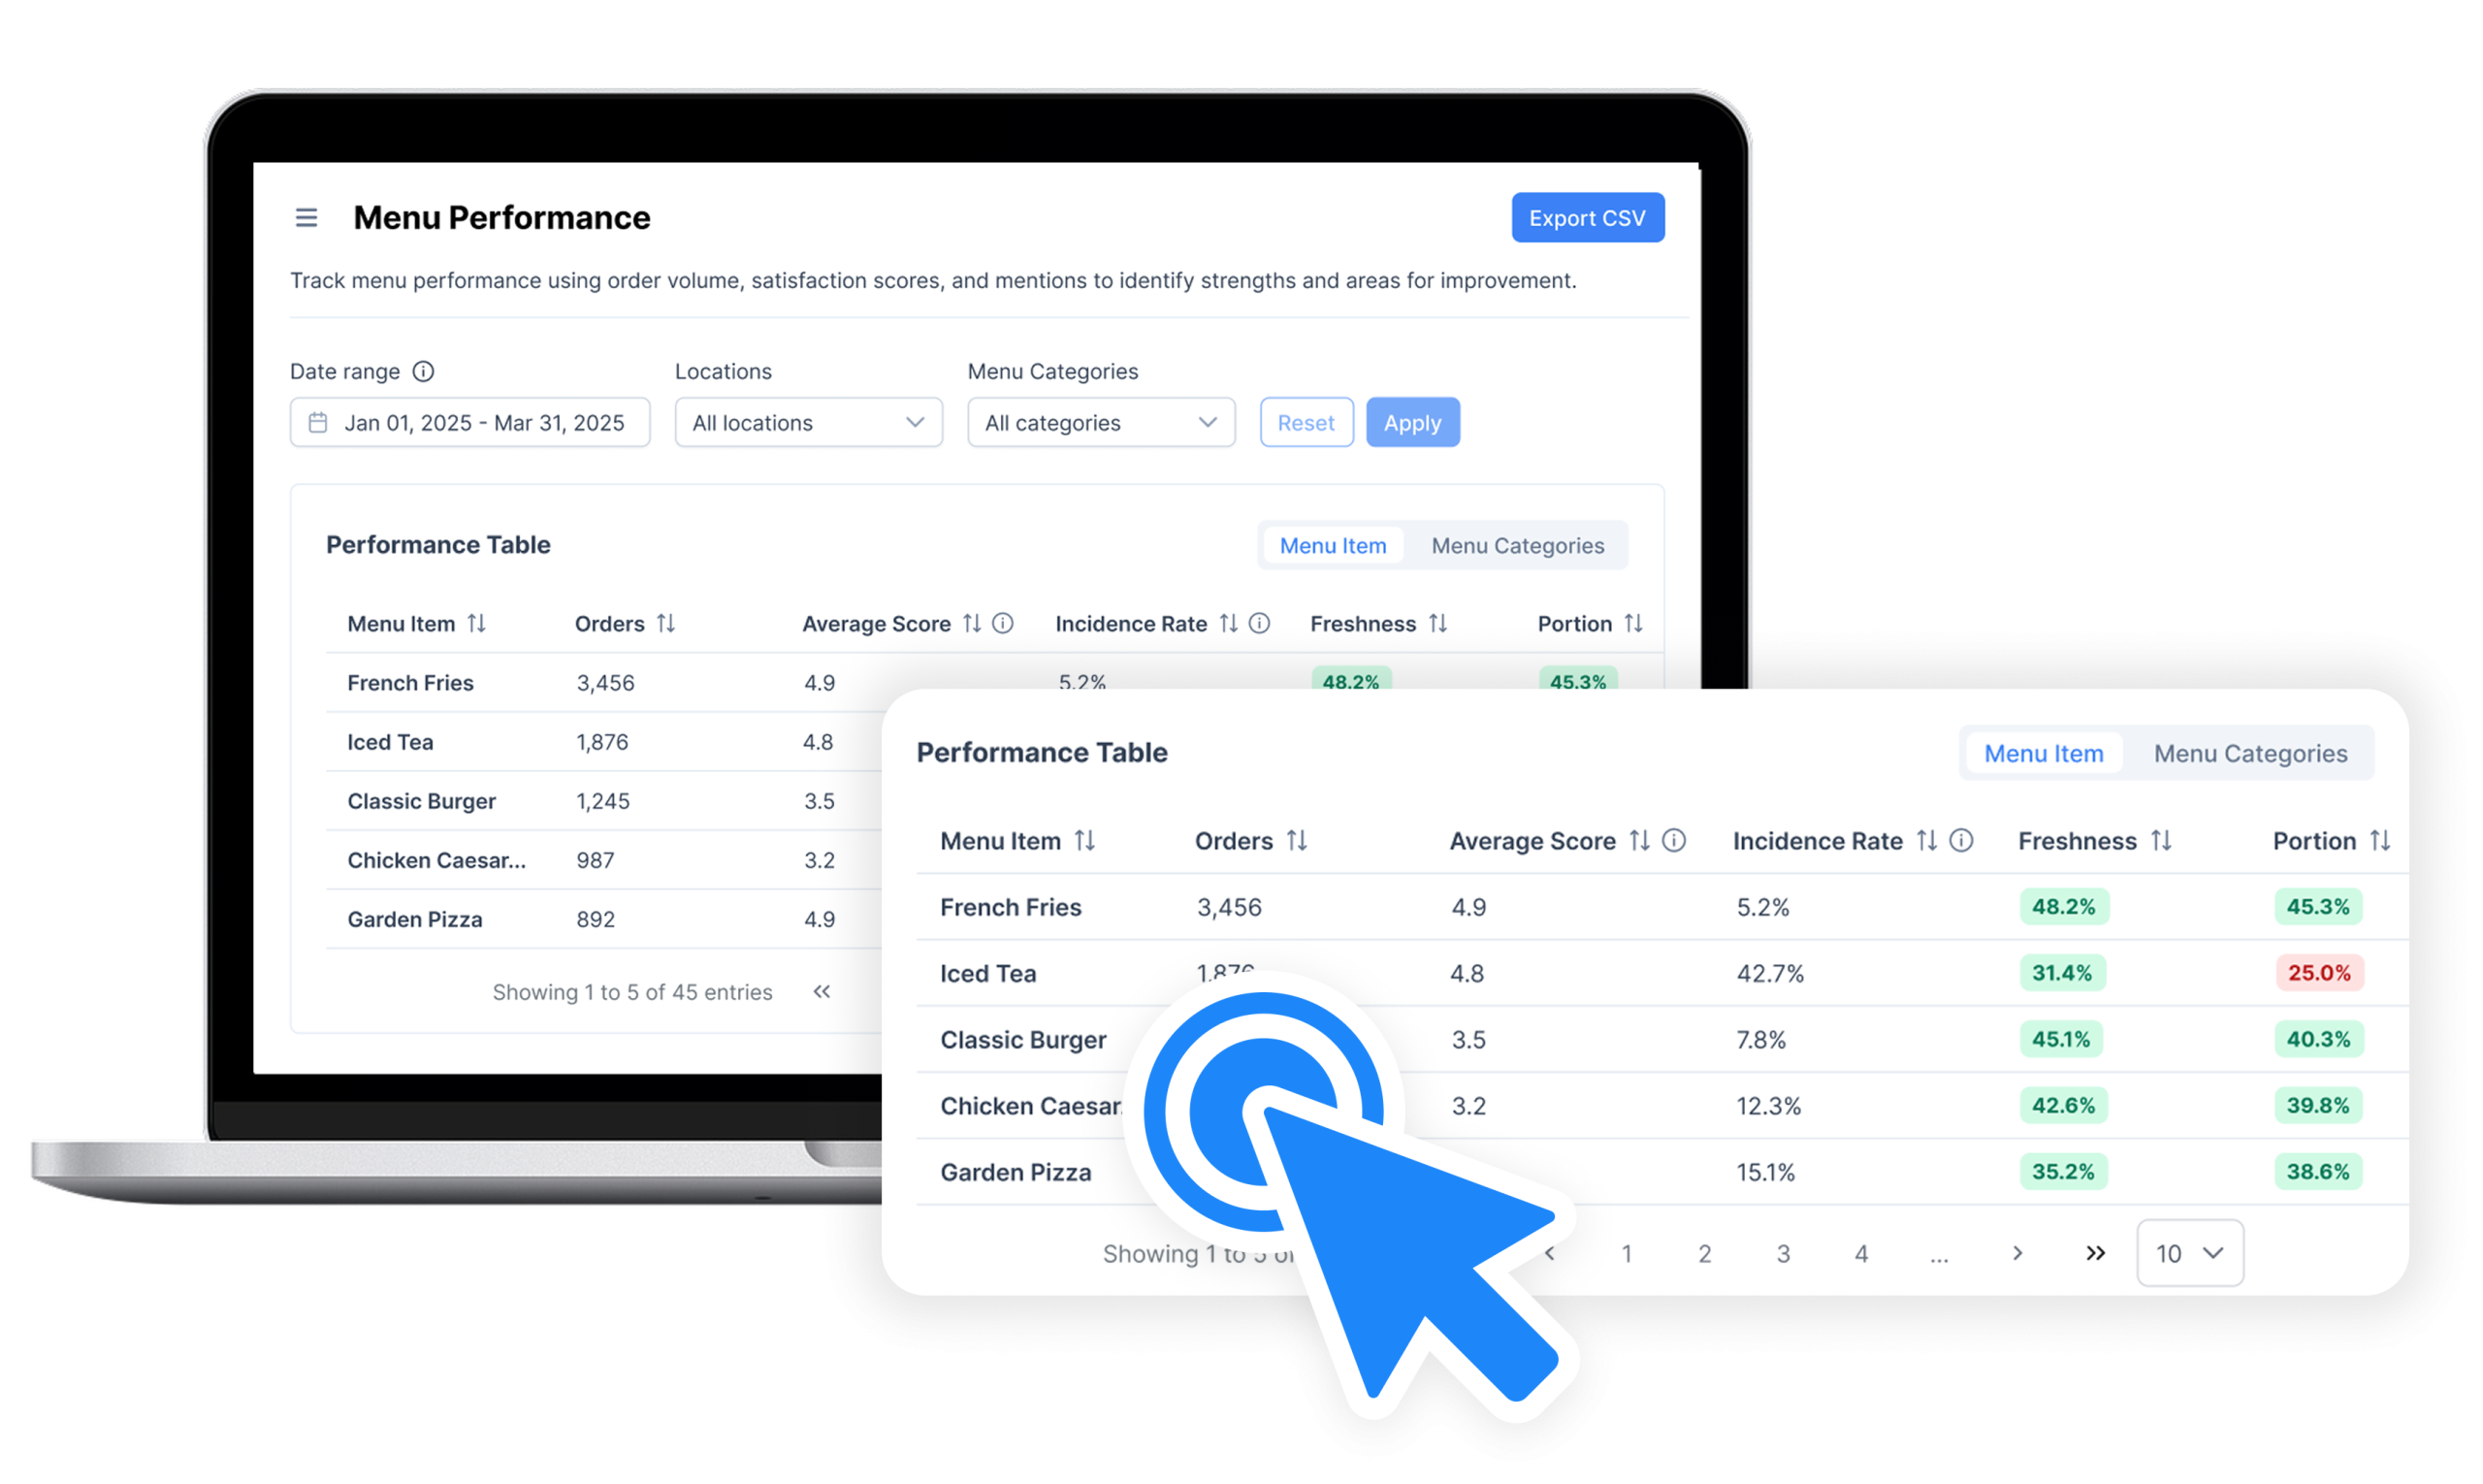
Sentiment tagged at the category level gets even more useful when it’s connected to specific menu items. If guests consistently flag one dish for portion size or inconsistent prep, that’s a direct signal for the kitchen, not a vague “some guests weren’t happy” note buried in a survey summary.
Looking at feedback by menu item also surfaces the flip side: dishes with consistently strong sentiment are candidates to promote, feature, or build LTOs around. Feedback data works for growth decisions, not just damage control.
Visual Formats Make Problem Areas Obvious at a Glance
Numbers in a spreadsheet still require someone to go looking for the problem. A heat map does the opposite: it shows which categories are underperforming at which locations the moment you open it, with detail just a click away. For multi-unit operators, this matters because the alternative is manually comparing dozens of location-level reports to spot outliers.
Visual reporting formats are especially useful for franchise and multi-brand operators who need a fast read across a large footprint before drilling into any one location’s specifics.

Segmenting by Location, Daypart, and Order Type Isolates Root Causes
A brand-wide sentiment score can hide a lot. A single underperforming location, a slow lunch daypart, or a delivery-specific packaging issue can all get averaged out of visibility in an aggregate number.
Segmenting feedback by location, time of day, and ordering method (dine-in, pickup, delivery) isolates the actual root cause instead of leaving teams to fix the wrong thing. It also allows brand-level and location-level teams to work from the same underlying data without stepping on each other’s priorities.
Insight Only Creates Value Once It’s Assigned and Tracked
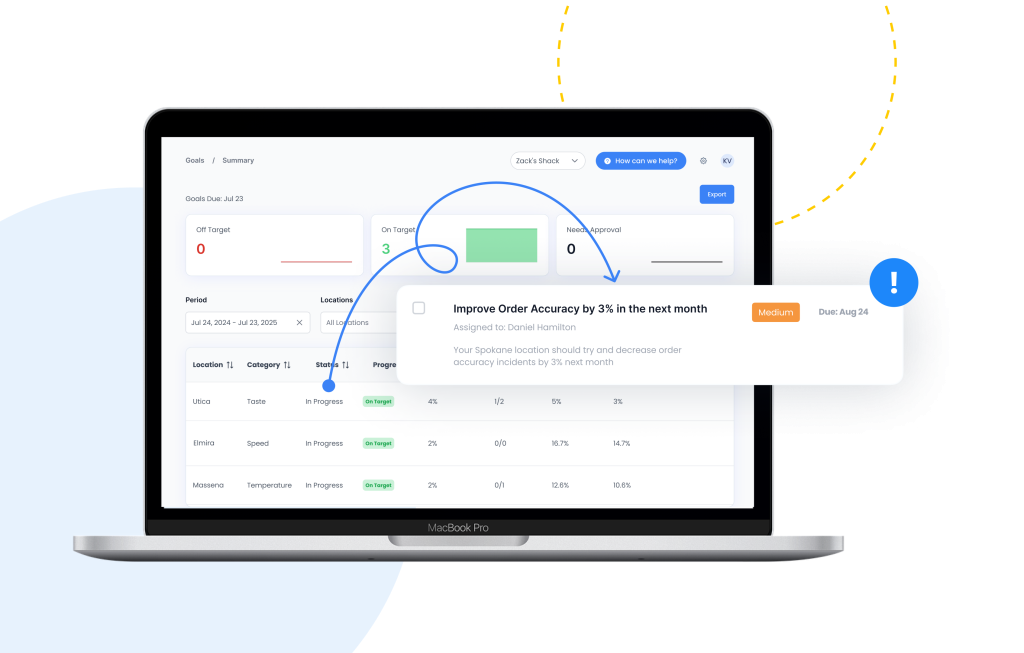
This is where most feedback programs stall. Reporting tells you what’s wrong; it doesn’t get anyone to fix it. The last mile is turning a pattern into a goal, a goal into an assigned action item, and an action item into a tracked outcome.
Setting a specific, time-bound goal (for example, improving order accuracy by a set percentage in a set window) and assigning clear next steps to the team responsible closes the loop between data and outcome. Without that step, feedback analysis is just a more sophisticated way of reading complaints.
Building a Repeatable Feedback Review Process
A few practices separate teams that act on feedback from teams that just collect it:
- Review categorized trends weekly, not just individual comments. Patterns matter more than any single review.
- Compare location performance against the brand average, not just against last month, to catch outliers early.
- Tie every recurring issue to an owner and a deadline. Insight without accountability doesn’t move the needle.
- Revisit menu-level sentiment before major menu changes, not just after guest complaints spike.
The Bottom Line
Restaurant feedback data becomes valuable the moment it’s organized, visualized, and connected to accountable next steps. Categorized sentiment analysis, menu-level reporting, heat maps, and location-level segmentation each solve a piece of that problem — but the real payoff comes from closing the loop with assigned goals and tracked action items.
Ovation’s Operational Insights tools are built around this exact workflow, from AI-driven categorization to goal tracking by location. If you want to see how it works for your restaurant, schedule a demo.